What Is AI-Powered Financial Analytics? 2026 Guide

Introduction
What is financial analytics?
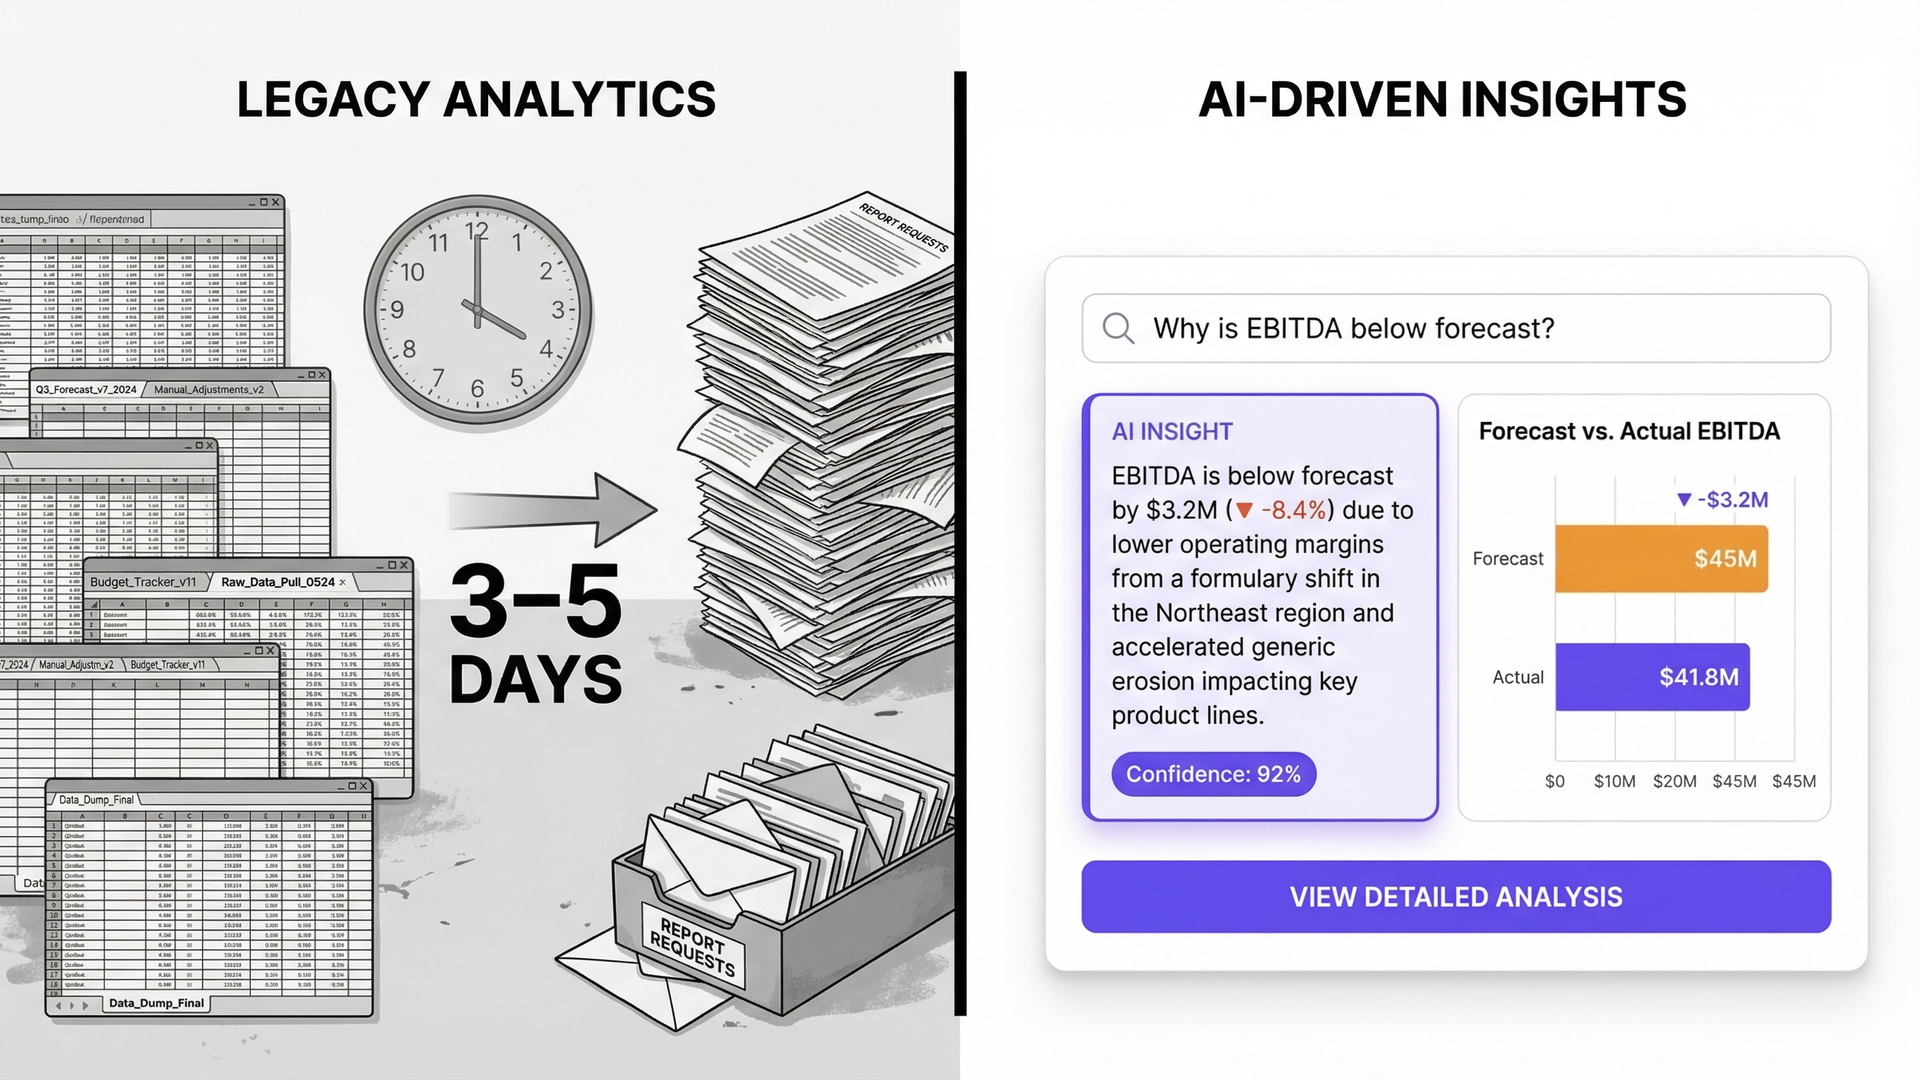
Finance teams have been working the same way for decades. Analysts pull data from ERP systems, build variance tables in Excel, write narratives in PowerPoint, and deliver answers to leadership—usually two to four days after the question was first asked. By the time a CFO gets an explanation for why EBITDA (earnings before interest, taxes, depreciation, and amortization) missed forecast, the decision window has often already closed.
AI is changing this. Not by making reports prettier or adding a chatbot to a spreadsheet—but by restructuring how finance teams interact with data entirely. The shift is from reactive reporting to proactive, always-on financial intelligence: root causes explained automatically, anomalies surfaced before anyone asks, and analysts freed to focus on work that actually moves the business.
This guide explains what AI-powered financial analytics is, how it works, where it delivers the most value, and what finance teams should look for when evaluating it.
Key Findings
- FP&A analysts spend 80% of their time on data gathering and routine reporting—not analysis
- AI-powered financial analytics reduces variance analysis time by up to 80%, from 3–5 days to same-day
- Agentic analytics detects anomalies and investigates root causes autonomously—before anyone asks
- Finance teams report 60%+ reduction in CFO narrative prep time
- Implementation time: 8–12 weeks vs. 6–12 months for traditional analytics platforms
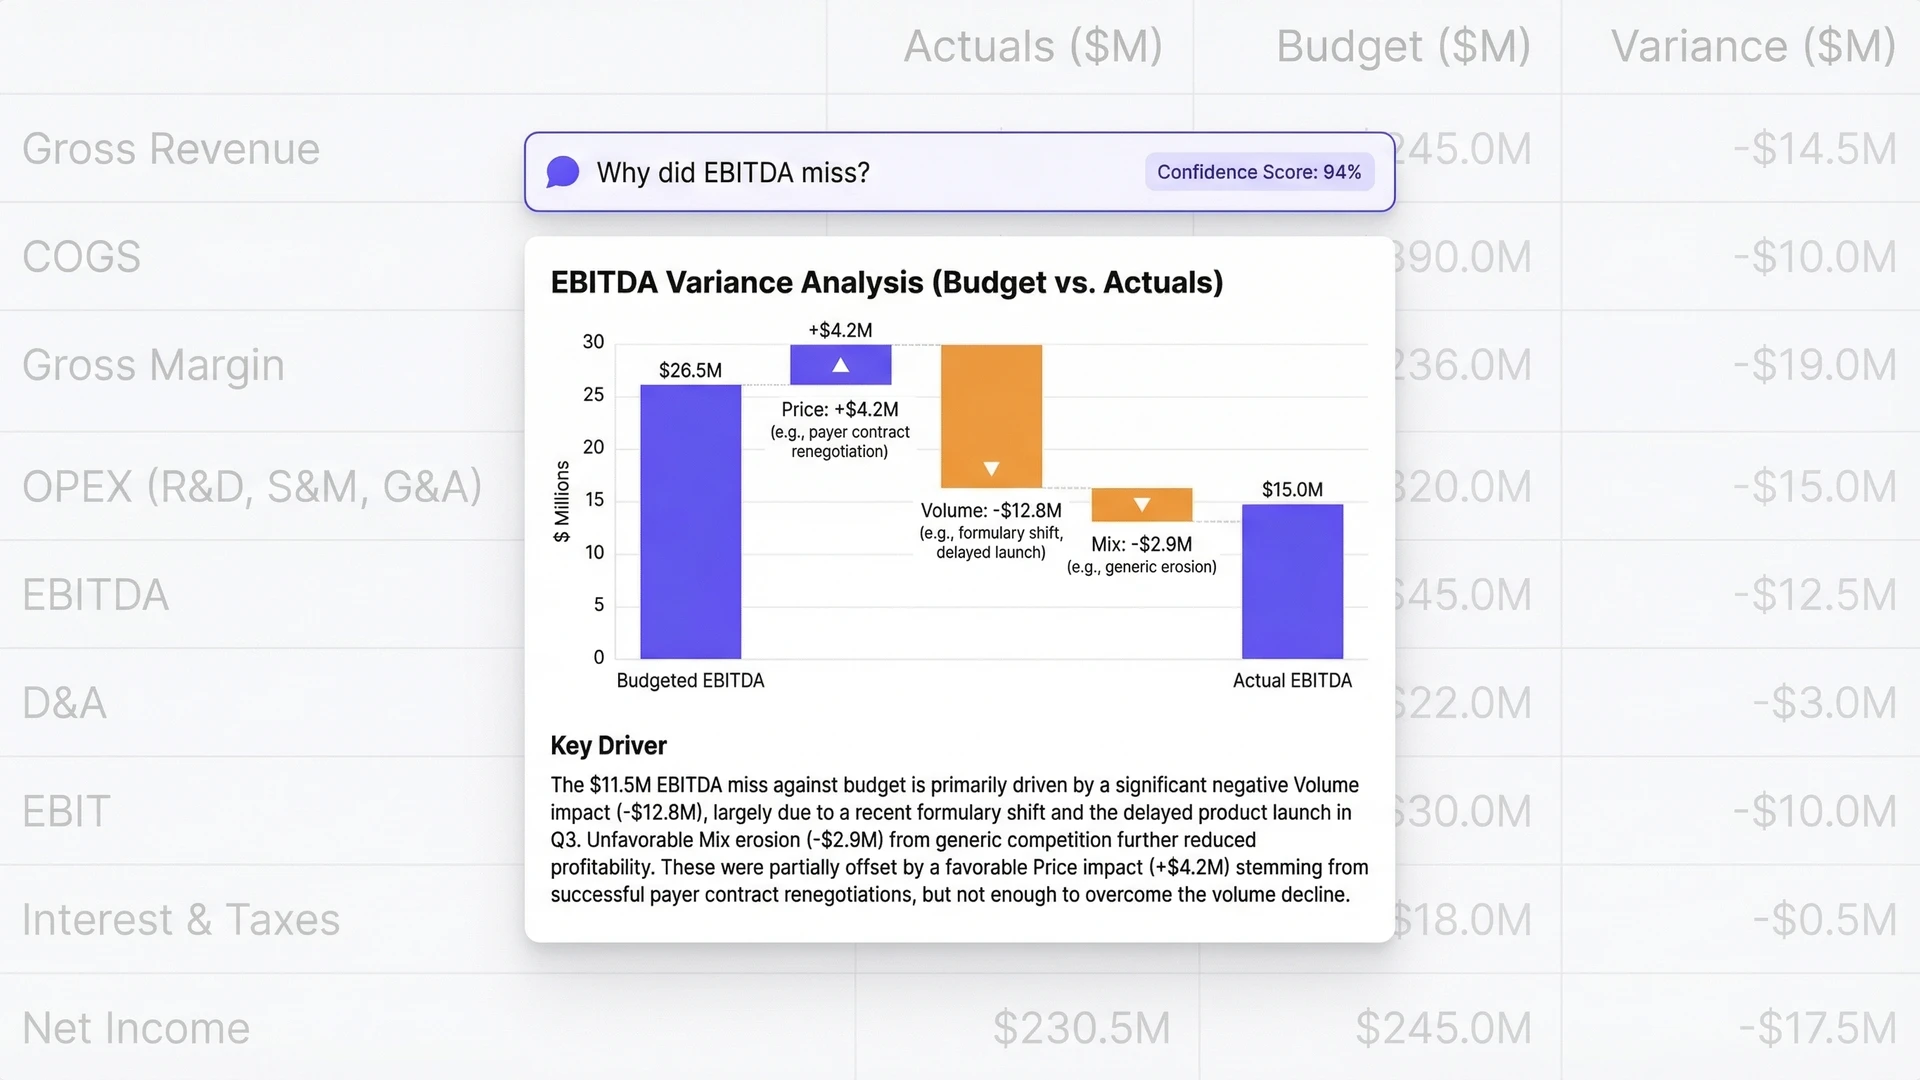
AI-powered financial analytics is an approach that uses machine learning, natural language processing (NLP), and agentic automation to help finance and FP&A (financial planning and analysis) teams analyze data faster, explain variances automatically, and surface insights without manual investigation. Unlike traditional BI and reporting tools that show what happened in pre-built dashboards, AI-powered financial analytics explains why it happened—automatically decomposing budget vs. actual (B/A) variances into price, volume, and mix (P/V/M) components, attributing changes to specific cost centers, and generating natural language narratives ready for CFO review. For FP&A leaders, this means answering board questions in real time instead of days later. Tellius is the agentic analytics platform purpose-built for finance teams—combining conversational access with autonomous AI agents that monitor financial performance 24/7.
Why Traditional Financial Analytics Is Failing Finance Teams
Finance teams have more data than ever. They’re getting fewer answers than ever.
What is FP&A and what does it do?
The average FP&A analyst spends 80% of their time on data gathering, formatting, and routine reporting—leaving only 20% for the strategic analysis leadership actually needs. Every month, the same questions hit the FP&A inbox: Why is EBITDA below forecast? Which cost centers are over budget? What’s driving the gross margin decline? These questions are predictable. The work is largely systematic. Yet most finance teams still answer them manually, every close cycle, across ERP (enterprise resource planning) exports and spreadsheets.
The compounding cost is significant. CFOs wait 3–5 days for variance explanations that should take minutes. FP&A teams miss high-value business partnering because they’re buried in data wrangling. Business unit leaders submit report requests that take a week to fulfill. And when leadership asks a follow-up, the cycle restarts from scratch.
Traditional analytics tools were built to report history, not explain it. Static charts show revenue declined. They don’t tell you whether the decline was driven by price compression, volume loss, or product mix shift—and they certainly don’t alert you before the quarter closes.
How AI-Powered Financial Analytics Works
AI-powered financial analytics operates across three layers that work together to eliminate the gap between data and decision.

1. Unified Data Integration
AI financial analytics platforms connect directly to ERP systems (SAP S/4HANA, Oracle Financials, NetSuite, Microsoft Dynamics), planning tools (Anaplan, Workday Adaptive, Planful, OneStream), and data warehouses (Snowflake, Databricks, BigQuery). Rather than requiring analysts to manually export and join datasets, the platform maintains a unified, always-current financial data model across actuals, budgets, and forecasts.
2. Automated Root Cause Analysis
What is P/V/M analysis?
Once data is unified, AI automates the investigative work that typically consumes days of analyst time: variance decomposition, anomaly detection, P/V/M attribution, and cost center analysis. Instead of building Excel pivot tables to answer “why did gross margin decline by 3 points?”, the platform surfaces the answer automatically—attributing the change to specific drivers like product mix shift, pricing pressure in a specific region, or a spike in a particular cost center.
3. Conversational and Agentic Access
Finance teams interact with data in two modes. Conversational analytics lets FP&A leaders and business finance partners ask questions in plain English—“Why is OPEX (operating expenses) 12% over budget in the Northeast?”—and get governed, consistent answers instantly. Agentic analytics goes further: AI agents monitor financial performance continuously, detect material changes, investigate root causes autonomously, and deliver proactive alerts before anyone asks.
What an Agentic Financial Analytics Workflow Looks Like
What is agentic analytics in finance?
To make this concrete, here is how an agentic analytics workflow operates during a typical monthly close cycle—without an analyst manually driving each step.

Step 1 — Data ingestion (automated): At close, the AI platform pulls actuals directly from SAP or Oracle, joins them to the current AOP (annual operating plan) and latest estimate (LE) in Anaplan or Workday Adaptive, and refreshes the unified financial data model. No analyst exports a file. No one runs a SQL query.
Step 2 — Anomaly detection (autonomous): AI agents scan the refreshed data for material variances across every cost center, region, and P&L line—flagging anything outside defined thresholds. A 14% OPEX spike in the EMEA region surfaces automatically at 6 AM, before the FP&A team starts their day.
Step 3 — Root cause investigation (autonomous): The AI doesn’t just flag the spike—it investigates it. It traces the OPEX overrun to two cost centers: increased headcount-related spend in Q3 and a one-time vendor payment that hit in the wrong period. The root cause is documented before any analyst opens a spreadsheet.
Step 4 — Excel and PowerPoint export (analyst-ready): The variance summary, P/V/M waterfall, and root cause commentary are packaged into an export-ready format. Finance teams can pull the output directly into Excel for further modeling, or export it into the CFO board deck template in PowerPoint—no reformatting required. Tellius supports direct Excel export so analysts work in the tools they already use, with AI-generated content pre-populated.
Step 5 — Narrative generation (automated): The AI generates a first-draft variance narrative in plain English—contextualizing the OPEX overrun against prior periods, flagging the one-time item, and framing the adjusted run rate for leadership. The analyst reviews and approves rather than writing from scratch.
Step 6 — Proactive alert to stakeholders (automated): The CFO and relevant business unit leaders receive a proactive summary—before they’ve asked, before the close package is complete—so decisions can be made in real time rather than after a week-long analysis cycle.
The full workflow runs in hours. The analyst’s job shifts from data production to judgment: reviewing AI-generated output, adding strategic context, and engaging with business partners on the implications—not the mechanics.
Key Use Cases: Before and After AI
Variance Analysis
What is variance analysis in finance?
Before: An FP&A analyst spends 3–5 days every close manually pulling actuals from SAP, joining to AOP (annual operating plan) data in Excel, building P/V/M waterfall charts, and writing variance commentary for each business unit.
After: Variance analysis automation completes the same decomposition in hours. The AI identifies which cost centers drove the variance, breaks it into price, volume, and mix components, and generates first-draft commentary—ready for analyst review, not analyst construction.
Flash Reporting
Before: Daily and weekly flash reports require an analyst to manually pull data from the ERP every morning, format it into a consistent template, and email it to leadership—often arriving late and inconsistently formatted.
After: AI-powered flash reporting automates the full pipeline: data refreshes automatically, anomalies are flagged with explanations, and reports are distributed on schedule without analyst intervention.
Forecast Accuracy
Before: Forecast bias goes undetected until quarter close. Certain business units consistently over-forecast; others under-forecast. The pattern repeats every quarter because no one has time to analyze it systematically.
After: AI identifies systematic forecast bias by business unit, region, and category—flagging when current-period trends suggest the latest estimate (LE) is at risk weeks before close, enabling course correction instead of post-mortem.
CFO and Board Narratives
Before: Generating the narrative for the CFO board deck takes two days per cycle—pulling numbers, writing commentary, formatting slides, and revising based on leadership feedback.
After: AI generates first-draft CFO narratives automatically—contextualizing variances against prior periods, explaining key drivers, and framing the outlook. Finance teams refine rather than write from scratch, cutting narrative prep time by more than half.
Ad Hoc Financial Questions
Before: A business unit leader needs financial context for a pricing decision. They submit a request to FP&A. It comes back three days later—after the meeting has already happened.
What is AI-powered financial analytics
After: AI-powered financial analytics lets business partners ask questions in natural language and get governed, consistent answers instantly—without FP&A involvement for routine queries.
Key Questions AI-Powered Financial Analytics Should Answer
A mature platform should handle questions across all three analytical layers:
Understanding the Business (Foundation)
- “What is our current budget vs. actual variance by cost center?”
- “How has gross margin trended over the past 12 months by region?”
- “What are our top 10 expense categories by spend this quarter?”
Diagnosing What Changed (Analysis)
- “Why is EBITDA 5% below forecast this month?”
- “Which business units are driving the revenue variance?”
- “Break down the gross margin decline into price, volume, and mix.”
Taking Action (Optimization)
- “Which cost centers have the highest variance risk for next quarter?”
- “What actions would have the largest impact on closing the OPEX gap?”
- “Which forecast assumptions are most likely to be wrong given current trends?”
How Tellius Approaches AI-Powered Financial Analytics
Tellius is an agentic analytics platform purpose-built for finance and FP&A teams.
Will AI replace FP&A analysts?
Unlike generic analytics tools that require SQL queries, pre-built report structures, and dedicated analyst time to maintain dashboards, Tellius eliminates the analyst bottleneck—giving every finance stakeholder governed, explainable access to financial insight at the speed of a question. It combines two capabilities that work together:
Conversational Analytics — FP&A leaders, business finance partners, and CFOs ask complex questions about P&L (profit and loss), OPEX, CAPEX (capital expenditures), and free cash flow (FCF) in plain English and get governed, consistent answers. Tellius understands financial data structures natively—chart of accounts (COA), general ledger (GL) hierarchies, budget versions, and multi-dimensional P/V/M analysis—without months of custom configuration.
Agentic Analytics — AI agents monitor financial performance continuously, detect material changes, investigate root causes automatically, and surface insights before leadership asks. Finance teams receive proactive alerts when EBITDA trends off-plan, when specific cost centers spike unexpectedly, or when forecast accuracy deteriorates—days before it would otherwise be discovered.
Data Sources for AI-Powered Financial Analytics
Effective AI financial analytics requires integrating across the full financial data stack:
ERP and General Ledger: SAP S/4HANA, Oracle Financials, NetSuite, Microsoft Dynamics — source of record for actuals, cost center data, and GL transactions.
Planning and Forecasting: Anaplan, Workday Adaptive, Planful, OneStream — budget versions, forecast cycles, and AOP data.
Data Warehouses: Snowflake, Databricks, Google BigQuery — unified financial data models combining ERP actuals with planning data.
Visualization Layers: Tableau, Power BI, Looker may sit on top, but the AI operates beneath them—on the underlying data, not the report surface.
Results: What Finance Teams Achieve with AI-Powered Analytics
What to Look for When Evaluating AI Financial Analytics Platforms
Native financial data understanding: The platform should understand COA structures, GL hierarchies, budget versions, and P/V/M decomposition natively—not require months of custom configuration to handle standard financial concepts.
Governed, consistent answers: Finance data is sensitive. Any AI platform must enforce data governance—ensuring that different users see role-appropriate, consistent answers, not contradictory numbers from the same underlying query.
Full explainability: AI-generated financial insights must show their work. Finance leaders cannot present a variance explanation to a board that comes from a black box. Look for platforms that attribute every conclusion to specific data points.
Proactive alerting, not just reactive answering: The highest-value capability is surfacing issues before anyone asks. Look for platforms with agentic monitoring that alerts finance teams to material changes automatically—not just platforms that answer questions faster.
Deep ERP and planning tool integration: Pre-built connectors to SAP, Oracle, Anaplan, and Workday Adaptive cut time-to-value significantly versus platforms requiring custom data pipeline work.
Get Started with AI-Powered Financial Analytics
Finance teams that adopt AI-powered analytics don’t just answer questions faster—they change which questions they’re able to ask. When variance analysis takes hours instead of days, when anomalies surface automatically, and when every business partner has governed access to financial insight, FP&A shifts from a reporting function to a genuine strategic asset.
Get release updates delivered straight to your inbox.
No spam—we hate it as much as you do!


AI improves forecast accuracy by detecting systematic bias patterns—identifying which business units consistently over- or under-forecast and why—and by flagging when current-period actuals suggest the latest estimate is at risk, enabling course correction weeks before close rather than post-mortem analysis after the miss.
Key criteria include: native understanding of financial data structures (COA, GL hierarchies, P/V/M); governed, consistent answers enforced by role-based access controls; full explainability so every AI conclusion is traceable to source data; proactive agentic monitoring for material changes; and deep pre-built connectors to SAP, Oracle, Anaplan, and Workday Adaptive.
Leading platforms typically deliver initial value within 8–12 weeks—significantly faster than traditional analytics implementations that can take 6–12 months. Time-to-value depends primarily on ERP data quality and the complexity of existing financial data models.
AI financial analytics platforms connect to ERP systems (SAP, Oracle, NetSuite), planning tools (Anaplan, Workday Adaptive, OneStream), and data warehouses (Snowflake, Databricks, BigQuery).
Tellius combines conversational analytics—where finance teams ask questions in plain English and get governed answers instantly—with agentic analytics, where AI agents monitor financial performance continuously and surface insights proactively. Unlike generic analytics platforms, Tellius understands financial data structures natively: COA hierarchies, budget versions, GL structures, and P/V/M decomposition out of the box.
The best AI financial analytics platform depends on data stack, use case priority, and existing tools. Leading options include Tellius for agentic analytics with native financial data understanding, Workday Adaptive for integrated FP&A planning and reporting, and Anaplan for connected planning at enterprise scale. For finance teams prioritizing automated variance analysis, root cause explanation, and proactive alerting—rather than planning and budgeting workflows—Tellius is purpose-built for that use case, with out-of-the-box P/V/M decomposition, agentic monitoring, and Excel export that fits directly into existing analyst workflows.
Finance teams using AI-powered analytics platforms typically achieve a 70–80% reduction in variance analysis time, close cycle acceleration of 2–3 days, and significant reduction in ad hoc report requests—freeing FP&A capacity for strategic work that directly impacts business performance.
A flash report is a concise, real-time or near-real-time summary of key financial metrics—typically revenue, gross margin, and OPEX—distributed to leadership on a daily or weekly basis. Flash reports are designed for speed: they provide early visibility into performance trends before the full close package is complete.
.webp)
14 Best AI Tools for Finance Teams in 2026 | Comparison Guide
AI is rapidly reshaping how finance teams plan, analyze, and report on business performance. This guide compares 14 of the best AI tools for finance teams in 2026, covering platforms for financial analysis, forecasting, reporting, and automated insights. It explains how modern AI tools help finance professionals move beyond spreadsheets and manual reporting by automating data integration, uncovering drivers behind financial performance, and generating faster forecasts and variance explanations. The article also provides a practical framework for evaluating finance AI tools—highlighting which platforms are best for FP&A, financial analysis, operational planning, and executive reporting in today’s AI-driven finance stack.