
Reason across every data source
structured, unstructured, and syndicated sources.
.png) Snowflake
Snowflake
 Salesforce
 Veeva
++
Veeva
++
 IQVIA
IQVIA
 Nielsen
 MMIT
++
MMIT
++
 Payer contracts
.svg.png) Board deck
Board deck
 Gong
++
Gong
++












Fragmented data and context
are why your AI efforts stall
"What" and "why" live apart
Your warehouse holds the metrics — the what happened. Your contracts, call notes, transcripts, and retailer commentary hold the why. Connecting them today is manual and unscalable.
Generic LLMs don't know your business
NBRx, gross-to-net, "active customer" — your team defines them one way, the model assumes another, and you spend the prompt explaining the difference. Re-explaining your business in every prompt is a bottleneck.
Rebuilding understanding from scratch sucks
Memory is fragmented and investigation methods live in people's heads, so every answer arrives without the benefit of the thousand answers before it.
Connect. Model. Sharpen.
Every source. Structured, unstructured, syndicated
— queried where it lives.
Native connectors to Snowflake, Databricks, Redshift, BigQuery, and your operational systems — plus first-class ingestion of PDFs, call notes, transcripts, and management commentary. Queries push down to your warehouse and run at cloud scale: no extracts, no second copy, no data egress. Everything joins the same intelligence layer.

Snowflake · brand_warehouse
Connected · 2 min ago
Struct

IQVIA Xponent · Q3 refresh
Connected · 2 min ago
Synd

Veeva CRM · call_activity
Streaming · live
Synd

payer_contracts_Q3.pdf
Processed · 14 min ago
Unstr

Nielsen Scan · weekly
Connected · 1 hr ago
Synd
MSL_call_notes_NOV.docx
Processed · 3 hrs ago
4.2M rows scanned · 1.24s
Unstr
Analysis-ready data in one conversation.
Import your semantic layer or simply describe what you want in plain language. Architect connects to your warehouse, discovers tables, infers joins, creates industry-specific metrics, and publishes a validated, governed Business View — with full SQL and Python escape hatches when you want them. Define your business meaning once, and every Mission, App, and Kaiya conversation works from the same model.
Models & joins
Metrics & KPIs
Data-explosion checks
De-dup
Version control
dbt YAML
Kaiya Architect
Connected to Snowflake
# Brand Performance Business View
business_view:
  name: brand_performance_bv
  schema: PHARMA_ANALYTICS
  refresh: weekly

tables:
  - name: iqvia_claims
    type: fact
    grain: weekly
  - name: hcp_roster
    type: dimension
  - name: territory_master
    type: dimension

joins:
  - from: iqvia_claims.npi
    to: hcp_roster.npi_number
    cardinality: N:1
    join_type: LEFT

measures:
  - name: market_share
    formula: brand_trx / total_market_trx * 100
Consistent, accurate answers. Sharper every day.
Business Views map your concepts — NBRx, gross-to-net, lift, pipeline coverage — to your physical data, once. Every output traces back through them. And Memory compounds: validated patterns, recurring drivers, what worked. The intelligence layer gets smarter every time it runs.

"Why did margin slip 80bps this close?"

Kaiya is reasoning
Applying 4 Business Views · checking Memory
Resolved gross_to_net Business View v3
Applied product mix definition CFO-approved
Cross-checked with Memory 142 prior
Reranking drivers by validated impact
Memory: sharpening since Mar 2024 · 1,247 investigations applied
Your data stays put. Every answer traces back.
01
Stays in place
No migration
It never leaves your perimeter
Connect Snowflake, Databricks, your apps and your documents where they already live. Live Mode pushes the query down to your warehouse — no extracts, no second copy.
Snowflake
Salesforce
Veeva
Documents
++
0 bytes leave your VPC
02
Unified once
One model
One model, one source of truth
Structured and unstructured map into one semantic layer. Your definitions — NBRx, gross-to-net, lift — set once, so the same question returns the same answer across every team and tool.
Semantic layer
1 governed model
03
Traceable
Audit-ready
Every answer traces back
Each output traces through the exact logic that produced it — right down to the source rows. Reproducible and audit-ready by design.
Source
→
Dataset
→
Business View
→
Answer
Reproducible · audit-ready
See it on your data
Watch the layer read
across your stack. Live.
30 minutes. Your data. Our engineers. Live, end to end.
On your live data
Real, governed output
Traceable by design
Your data. Your perimeter.
Your governance.
Ask Across All Your Data
0 bytes egress. Pushdown to Snowflake, Databricks, Redshift, BigQuery. Data never leaves your perimeter.Row + column governance
Enforced at the semantic layer, not the dashboard. One policy, every surface.
Every query traced
Full audit log with Business View attribution. Every output reproducible to its source.
SOC 2 Type II
Audited annually. Continuous controls monitoring across security, availability, confidentiality.
HIPAA + GDPR ready
Deployed in regulated pharma and financial environments since 2018. BAA available.
HIPAA + GDPR ready
SSO · SAML 2.0 · SCIM · RBAC. Okta, Azure AD, Ping — all native.
SOC 2 Type II
HIPAA
GDPR
AI Native since 2016
Breakthrough Ideas, Right at Your Fingertips
Dig into our latest guides, webinars, whitepapers, and best practices that help you leverage data for tangible, scalable results.
.webp)
How Market Access Teams Verify Contracted Access Across Eligible Plans

Contracted access doesn’t guarantee that every eligible payer plan implements the agreed terms. This guide shows pharma market access teams how to verify contract clauses against plan-level policies, books of business, benefits, indications, and effective dates. Learn how to distinguish confirmed matches from implementation gaps, exclusions, and unresolved cases—and build an evidence-backed account brief that gives payer teams a clear path to resolution.
.webp)
Why Invoices Get Blocked in Three-Way Matching, and How to Resolve Them
Blocked invoices often persist because the evidence needed to resolve them is scattered across invoices, purchase orders, receipts, and contracts. This guide explains how to resolve three-way match exceptions by linking records at the line level, identifying root causes and owners, validating prices against governing contracts, and routing corrections for review. It also shows how AI-powered spend validation can assemble evidence, surface discrepancies, and help AP and procurement teams clear exceptions faster while maintaining human approval.
.webp)
Budget vs. Actual: How to Verify a Favorable Variance Before You Reforecast
A favorable budget variance isn’t automatically a saving. This guide shows FP&A teams how to verify budget vs. actual variances before reforecasting—reconciling GL data, distinguishing timing from permanent changes, tracing missing spend, and documenting open items. It also explores how AI-powered variance workflows can bring evidence together, investigate drivers, and draft finance commentary while keeping forecast decisions under human review.

AI-Native Analytics at Launch Scale | PMSA Agios Full Webinar
Watch the Agios Pharmaceuticals PMSA webinar and see how AI-native analytics is helping commercial teams accelerate insights at launch scale. The discussion explores how AI can streamline analysis, uncover performance drivers, and help pharma teams make faster, data-driven decisions.
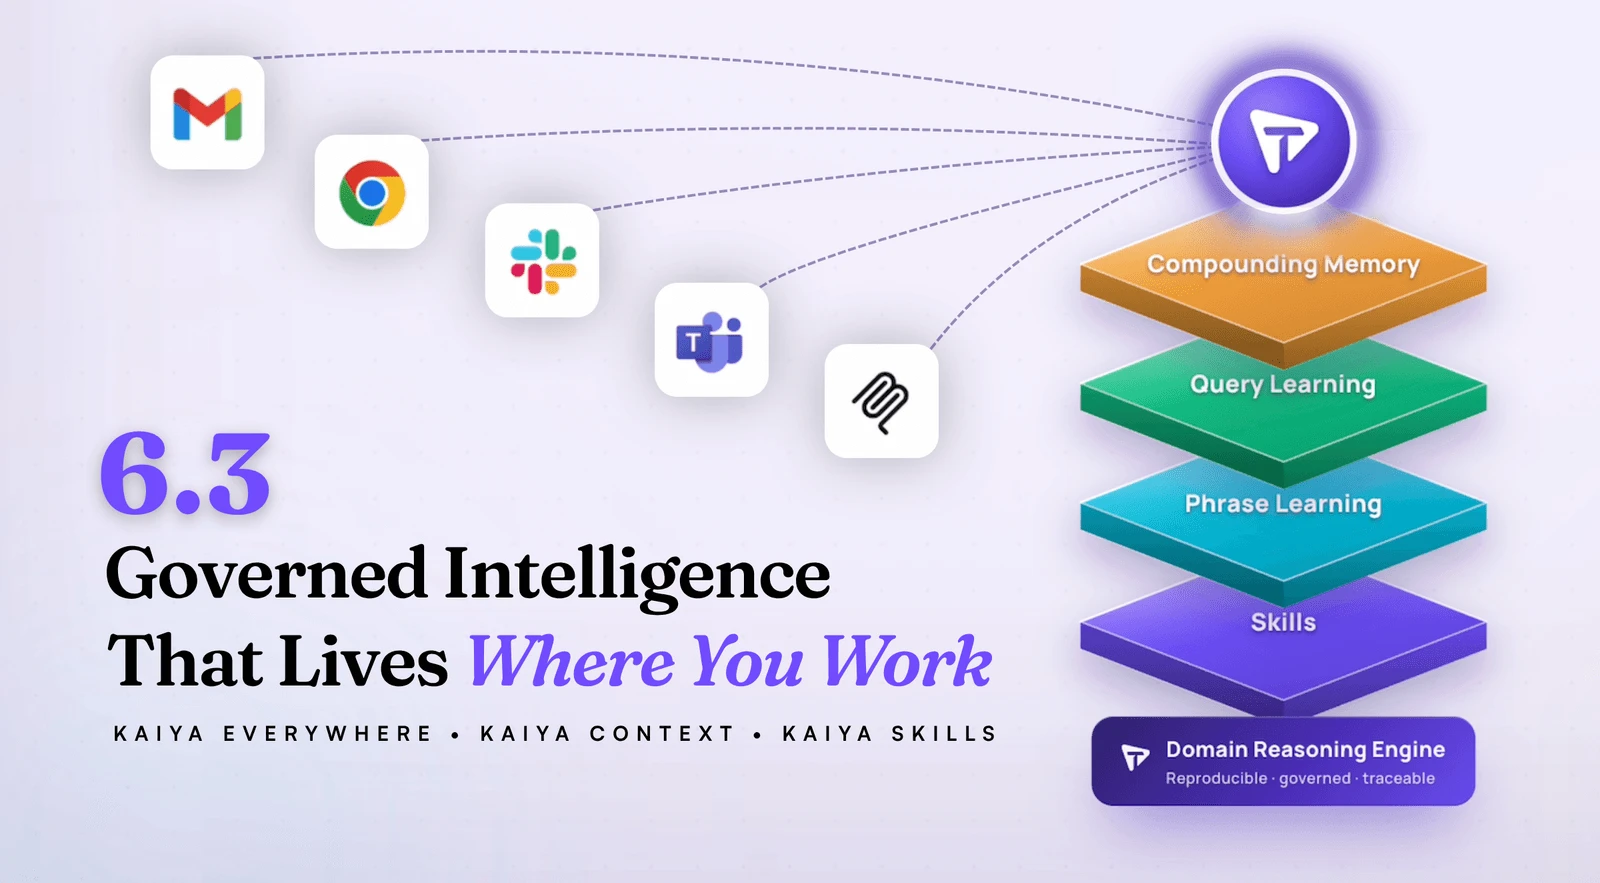
Tellius 6.3: Kaiya Everywhere, Grounded in Your Business
AI answers are only useful when they're grounded in your business and available where decisions actually happen. See how Tellius 6.3 delivers fast, traceable insights across pharma, CPG, RevOps, and FP&A — right in the tools your team already uses.

PMSA Webinar: Proactive Pharma Intelligence—A Practical Blueprint
See how pharma teams are using agentic AI to collapse the data-to-insight bottleneck—turning claims, contracts, and sales data into governed analytics models in one conversation instead of weeks in queue.
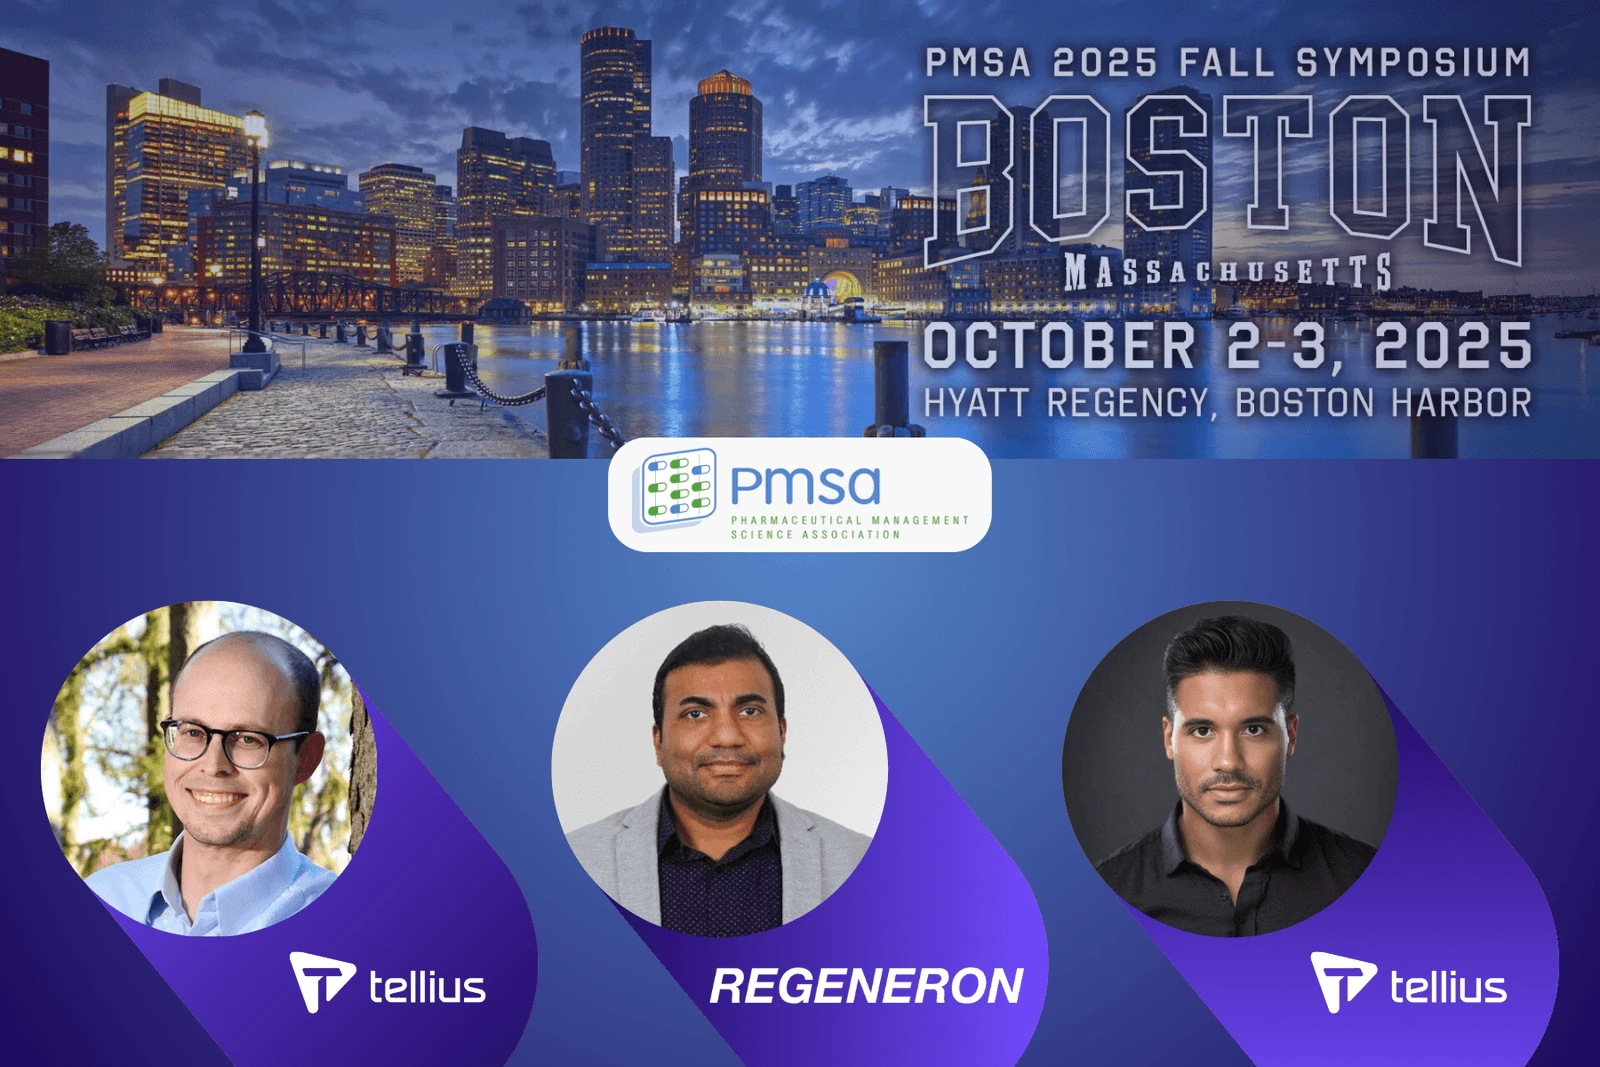
PMSA Fall Symposium 2025 in Boston
Join Tellius at PMSA Oct 2–3 for two can’t-miss sessions: Regeneron on how they’re scaling GenAI across the pharma brand lifecycle, and a hands-on workshop on AI Agents for sales, HCP targeting, and access wins. Discover how AI-powered analytics drives commercial success.
.webp)
Tellius AI Agents: Driving Real Analysis, Action, + Enterprise Intelligence
Tellius AI Agents transform business intelligence with dedicated AI squads that automate complex analysis workflows without coding. Join our April 17th webinar to discover how these agents can 100x enterprise productivity by turning questions into actionable insights, adapting to your unique business processes, and driving decisions with trustworthy, explainable intelligence.